
Research Team
Co-Principal Investigator: Daniel Aldana Cohen, Assistant Professor of Sociology, University of Pennsylvania
Co-Principal Investigator: Nick Graetz, PhD Candidate, Demography and Sociology, University of Pennsylvania
Co-Investigator: Kevin Ummel, Research Affiliate, Population Studies Center, University of Pennsylvania and President, Greenspace Analytics
Co-Investigator: Seth J. Prins, Assistant Professor, Epidemiology and Sociomedical Sciences, University of Pennsylvania
Project Summary
The Socio-Spatial Climate Collaborative, or (SC)², aims to deepen understanding of the intersection of social, health, and environmental inequalities in the built environment, with an eye to public engagement and informing policy. By focusing on questions of both carbon and well-being, we use big data to link social inequalities with the causes and effects of climate change in a single framework.
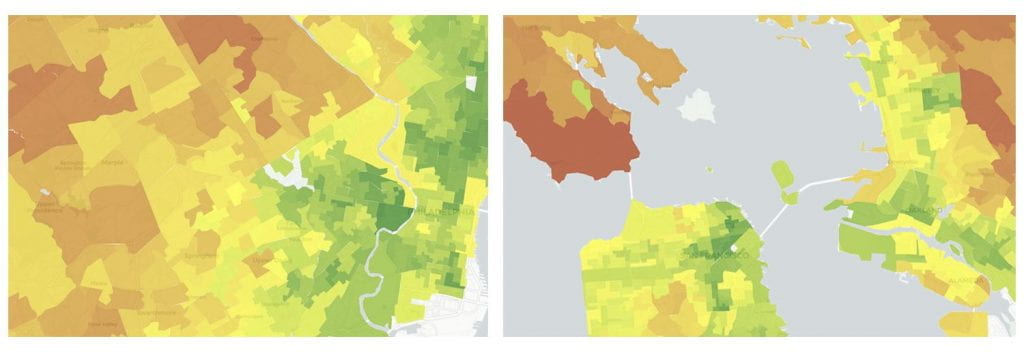
(SC)²’s first research project is Whole Community Climate Mapping, a collective, interdisciplinary project to create, analyze, and share with the public a household carbon footprint database and climate vulnerability index for the United States of unprecedented spatial resolution, along with a wide range of other social, health, and environmental indicators—all at the neighborhood level.
We explain some upshots of our approach in Follow the Carbon: The Case for Neighborhood-Level Carbon Footprints, a Policy Digest for Penn’s Kleinman Center for Energy Policy.
More broadly, will publish our results in top journals, make our data public, work with community groups and policymakers on problems that we determine through collaborative processes, and we will produce an attractive, interactive mapping tool for the public and policy-makers.
As inequality becomes increasingly fractal, we need such fine-grained analysis both to understand what is going on. And we need neighborhood-level data to inform the kinds of targeted investments needed to alleviate social and environmental distress in an effective and egalitarian way.
Indeed, in summer and fall 2019, our chief focus will be a project called Heat Mapping, a multi-dimensional look at where and why particular neighborhoods have so many households that can’t afford to keep their homes’ temperature safe—a terrible vulnerability when potentially murderous heat waves are projected to get stronger and more frequent in the years ahead. We know, for instance, that in the mid-Atlantic, half of black households can’t afford their utility bills. We know that in cities like Washington, DC, the number of extreme heat days is expected to increase by a factor of 10 in the coming decades. We need more detail. We’re risking eco-apartheid, where the poor and racialized suffer intense and disproportionate harms from extreme weather. Targeted investments could prevent homes from suffering unsafe heat and slash carbon emissions through more efficient cooling systems. How can we act effectively?
In all of our projects, we remain focused on root causes. Greenhouse gas (GHG) emissions are the root cause of climate change, one of the gravest threats facing humans in the 21st century. But we still know little about the intersection of demographic and geographic drivers of GHG emissions, and their overlap with a range of climate, health, and social vulnerabilities. Our knowledge is especially weak at neighborhood level, where cutting edge big data approaches are promising. We could better understand exactly which neighborhoods’ homes would benefit most from immediate weatherization and appliance replacement, reducing pollution, poverty, vulnerability, and discomfort all at the same time.
Yet, we still have only the roughest understanding of how much income inequality shapes emissions, and how these same patterns shape unequal vulnerabilities to climate change and other health threats. Growing public discussions of a Green New Deal show just how much interest there is in holistic narratives about climate change and inequality. Whole Community Climate Mapping will provide the kind of missing data (and visual tools) that could support public and policy debates on how to tackle climate change’s causes and effects in an intersectional fashion.
(SC)² has received support at the University of Pennsylvania from the Population Studies Center, Penn’s Kleinman Center for Energy Policy, Penn’s FELS Policy Research Initiative, and Penn’s Perry World House. We are actively seeking further funding to complete and communicate our research.
Select Publications
Daniel Aldana Cohen and Kevin Ummel. 2019. Follow the Carbon: The Case for Neighborhood-Level Carbon Footprints. Policy Digest. Kleinman Center for Energy Policy. July 2.
Rice, Jennifer L., Daniel Aldana Cohen, Joshua Long, and Jason R. Jurjevich. 2019. “Contradictions of the Climate-Friendly City: New Perspectives on Eco-Gentrification and Housing Justice.” International Journal of Urban and Regional Research. Online first, March 1.
Graetz, Nick. et al. 2018. “Mapping local variation in education across Africa, 2000-2015.” Nature 555: 48-53.
Ummel, Kevin. 2016. Impact of CCL’s Proposed Carbon Fee and Dividend Policy: A High-Resolution Analysis of the Financial Effect on U.S. Households.
Wachsmuth, David, Daniel Aldana Cohen, and Hillary Angelo. 2016. “Expand the Frontiers of Urban Sustainability.” Nature 536:391–93.
Cohen, Daniel Aldana. 2016. “Petro Gotham, People’s Gotham.” Pp. 47–54 in Nonstop Metropolis: A New York City Atlas, edited by R. Solnit and J. Jelly-Shapiro. Berkeley: University of California Press.
Gonalons-Pons, Pilar. 2015. “Gender and Class Housework Inequalities in the Era of Outsourcing Hiring Domestic Work in Spain.” Social Science Research 52: 208–18.